Contributors and Profiles
Individual Profiles
Every contributor who has merged a scored pull request gets their own profile page in GitVelocity. Profiles bring together everything about an individual's work in one place -- great for 1:1 conversations, celebrating wins, and supporting growth.
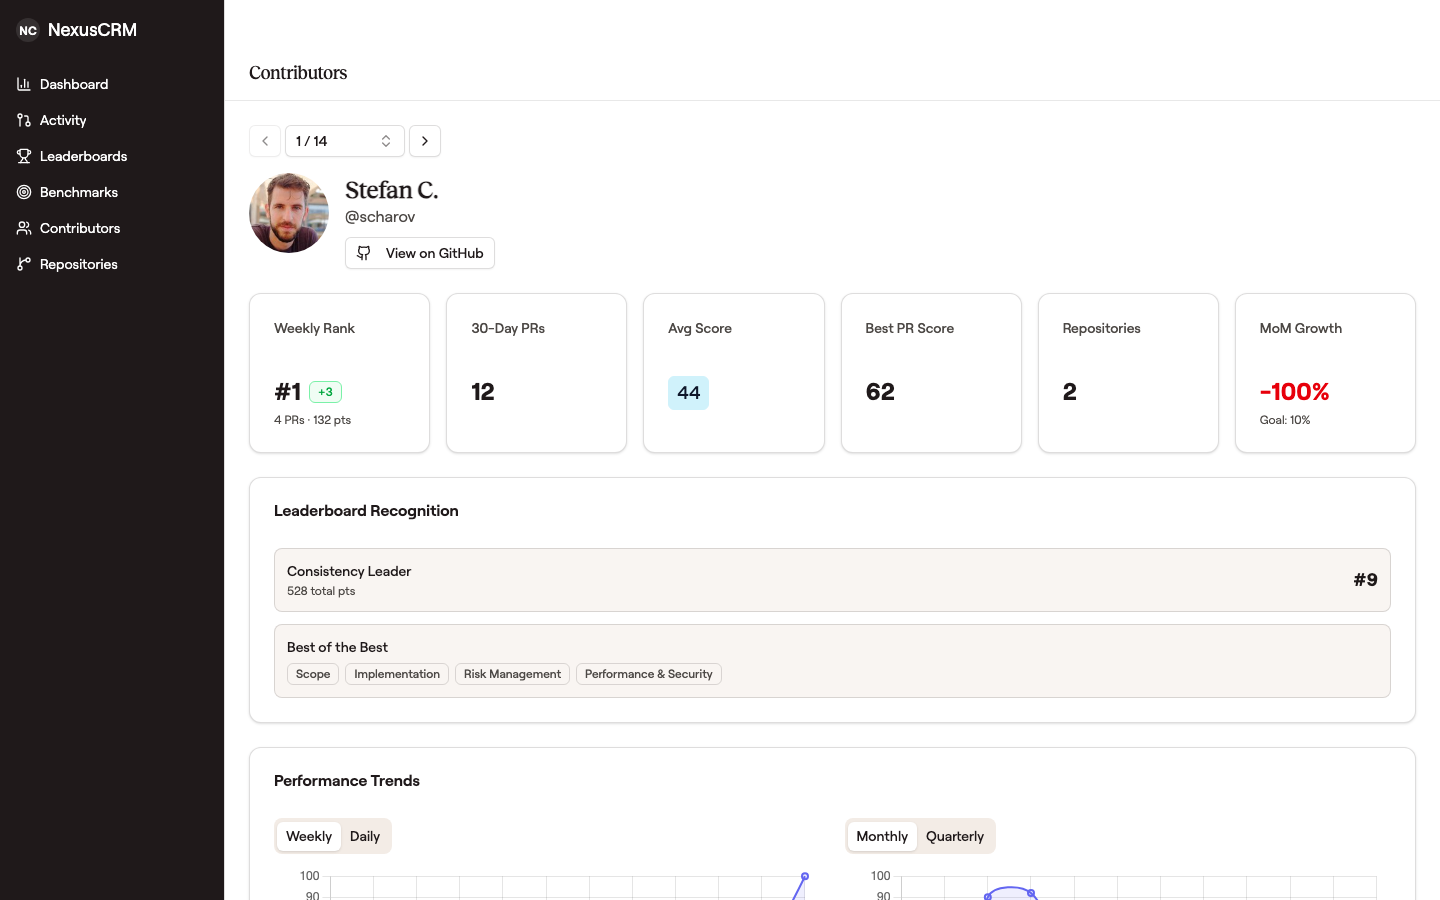 A profile aggregates rank, recent PR volume, average and best scores, repositories touched, and growth — all the context you need for a 1:1 — without leaving the page.
You can reach a profile by clicking a contributor's name on the Contributors page, the Sprint Board, the Dashboard achievements feed, or the Reporting page. A searchable dropdown and prev/next buttons on each profile make it easy to browse through the whole team.
Performance Trends
Each profile includes side-by-side trend charts that show how a contributor's velocity is evolving. You can toggle between short-range views (Weekly and Daily) and long-range views (Monthly and Quarterly). A dashed Team Median line provides helpful context -- it's not about comparing people, but about understanding where someone fits and how they're progressing.
Growth Rate
The Growth Rate section tracks period-over-period score changes as a bar chart. Green bars mean growth, red bars mean a dip -- and both are completely normal. To keep charts readable, extreme spikes (like coming back from vacation) are capped visually, though the real value still appears in the tooltip.
Personal Growth Goals
Each contributor can set their own personal growth target by clicking the goal badge on the Growth Rate card. A slider makes it easy to pick a number that feels right -- there's no wrong answer. The goal line appears on the growth chart as a personal reference point, not a mandate. Even small, consistent improvements add up over time.
Achievements
When a contributor reaches a new milestone -- a personal best score, a monthly high, or a cumulative achievement -- it shows up in their Achievements feed. Teammates can react to achievements with emoji, making recognition feel natural and lightweight.
Leaderboard Recognition
If a contributor is ranking on any of the leaderboards, their profile highlights it:
- Most Improved -- showing strong recent growth
- Consistency Leader -- delivering reliably week after week
- Best of the Best -- top-ranked in specific scoring dimensions like Architecture, Quality, or Risk Management
These recognitions are a great way to celebrate strengths during team conversations.
Summary Metrics
A row of metric cards gives you a quick snapshot:
- Weekly Rank with position change indicator
- 30-Day PRs merged and scored
- Average Score across recent work
- Best PR Score -- their highest-scoring contribution
- Repositories contributed to
- Month-over-Month Growth with personal goal reference
Score Distribution
The score distribution breaks down a contributor's recent PRs into High, Medium, and Low ranges. This isn't about judging -- it gives you objective context for understanding the complexity mix of someone's work. An engineer who mostly ships high-complexity PRs is tackling different challenges than one delivering steady moderate-complexity features, and both patterns are valuable.
Repositories
A quick view of which repositories a contributor has been active in over the last 30 days.
Managing contributor identities
Sometimes the same person shows up more than once -- a teammate created a second GitHub account, or a commit was pushed with an email that isn't linked to any account. GitVelocity gives admins two ways to keep everyone's work rolling up to the right person. Both are under Settings.
Merge duplicate accounts
On Settings → Team Display, open a contributor's row menu and choose Merge to roll a duplicate account into the right person. Their history -- velocity, leaderboard position, and trends -- combines under one profile, retroactively. The survivor's row shows how many accounts were merged into it, and any merge can be undone.
Attribute unattributed commits
When a commit is pushed with an email that has no linked GitHub account, it lands under the raw author name with no profile attached. Admins see an amber "unattributed commits" prompt in the sidebar; opening Settings → Unattributed Commits lists each one (expand a row to see the underlying commits) so you can link it to the right person. Linked commits immediately count toward that person's stats, and a link can be undone at any time.
Dismiss authors who aren't on the team
Not every unattributed author is a teammate -- an occasional contractor or a one-off contributor may never need a profile. On Settings → Unattributed Commits, choose Dismiss to mark an author as not part of the team. They drop off the unattributed list, clear the amber sidebar prompt, and are excluded from the leaderboard and reports. Dismissed authors appear in a Dismissed authors section where you can Restore them at any time.
Use Cases
1:1 Conversations
Use a contributor's profile to ground discussions in real data. Instead of relying on memory, reference specific trends, achievements, and growth patterns together.
Celebrating Wins
Achievements, leaderboard recognition, and growth milestones give you concrete things to celebrate. Sharing a profile during a team meeting or Slack message makes recognition feel specific and genuine.
Supporting Growth
Growth charts and personal goals help contributors take ownership of their development. Score patterns across dimensions can reveal opportunities -- an engineer who consistently scores well on Implementation but lower on Architecture might be ready for more system-design work.