How Scoring Works
Every pull request that merges to your main branch receives a complexity score from 0 to 100. This score measures the engineering complexity of the change — not the quality of the code, not the value of the engineer, and not the importance of the feature.
This page explains the scoring system end to end: the formula, the six dimensions, the Effort Scale Factor, and the consistency guarantees that make the numbers trustworthy.
The Formula
Scoring has two stages:
Final Score = Base Score x Effort Scale Factor
The Base Score is the sum of six rubric dimensions that evaluate what the PR does — scope, architecture, implementation, risk, quality, and performance/security. Each dimension has a defined range, and the maximum possible base score is 100.
The Effort Scale Factor (ESF) is a multiplier between 0.10x and 1.00x based on PR size. Larger changes require more effort to develop, test, and review, so they receive a higher multiplier.
This two-stage approach means the score captures both the nature of the work and the scale of the effort.
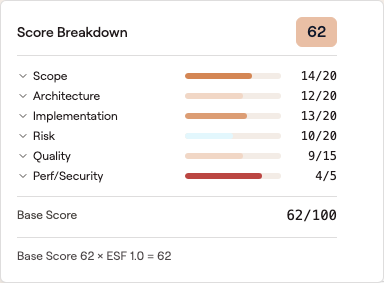 Both stages of the formula are visible in one place: the six dimensions sum to a 62/100 base score, and the ESF calculation underneath shows the multiplier applied to produce the final number.
The Six Dimensions
The base score is a simple addition of six dimension scores:
| Dimension | Range | What It Measures |
|---|---|---|
| Scope | 0-20 | Breadth of change across files and subsystems |
| Architecture | 0-20 | Structural impact on the system's design |
| Implementation | 0-20 | Algorithmic and logic complexity |
| Risk | 0-20 | Deployment and operational risk |
| Quality | 0-15 | Test coverage, documentation, and craftsmanship |
| Performance & Security | 0-5 | Explicit optimization and hardening work |
Base Score = S + A + I + R + Q + P
The base score evaluates implementation code only. Test files and documentation files are excluded from the base score calculation but are considered separately — test quality is reflected in the Quality dimension, and test effort is captured by the Effort Scale Factor.
We chose simple addition over weighted formulas deliberately. With addition, you can look at any score breakdown and immediately see where the points came from. There is no hidden weighting, no normalization, and no curve. The math is transparent.
For a detailed breakdown of each dimension with score ranges and anchored examples, see The Six Dimensions.
The Effort Scale Factor
The ESF adjusts the base score for PR size. A brilliantly designed 5-line fix gets a lower final score than the same quality work in a 500-line feature, because larger changes require more effort to develop, test, and review.
The ESF uses lines changed as the primary signal, with a file-count adjustment for cross-cutting changes. There are six tiers:
| Tier | Lines Changed | Multiplier |
|---|---|---|
| Nano | 1-10 | 0.10x |
| Micro | 11-50 | 0.25x |
| Small | 51-150 | 0.40x |
| Medium | 151-400 | 0.60x |
| Large | 401-800 | 0.80x |
| XL | 801+ | 1.00x |
If a PR touches significantly more files than its line count suggests (the file tier is 2+ levels above the line tier), the ESF bumps up by one tier. This is the 2-tier gap rule, and it accounts for cross-cutting changes like renaming a widely-used function.
For the full ESF mechanics and worked examples, see Effort Scale Factor.
How It Differs from Story Points and Lines of Code
Traditional approaches to measuring engineering work each have fundamental problems:
Story points are subjective estimates made before the work happens. They measure what the team guessed, not what was actually shipped. Two teams will assign different point values to identical work. Points drift over time. And they cannot be compared across teams.
Lines of code rewards verbosity and punishes elegance. A developer who deletes 500 lines of dead code shows up as negatively productive. A developer who copy-pastes their way to 2,000 lines looks like a hero.
Commit counts reward splitting work into tiny pieces. The engineer spending three days on a critical migration looks idle next to someone pushing whitespace changes.
GitVelocity scoring takes a different approach: look at the code that was actually written. The AI reads every pull request — the diff, the file structure, the test coverage — and evaluates it against a structured rubric. The output captures the complexity of what shipped, not what was planned.
Key differences:
- Post-hoc, not predictive. Scores are assigned after the code is written, based on what shipped.
- Objective and consistent. The same rubric is applied to every PR by the same AI model. No mood, no politics, no recency bias.
- Transparent. Every score includes a per-dimension breakdown with reasoning. You can see exactly why a PR scored what it did.
- Gaming-resistant. The AI reads the actual code. Splitting one PR into five does not increase total score — the complexity is in the code, not the ticket count.
- Language-agnostic. The rubric works across Python, TypeScript, Rust, Java, Go, Ruby, Swift, Kotlin, C#, and more.
The AI Model
GitVelocity uses an LLM to score every PR. Claude Sonnet 4.6 is the default — it delivers near-perfect correlation with Opus at a fraction of the cost. For teams that want maximum scoring accuracy, Claude Opus 5, Opus 4.8, Opus 4.7 and Opus 4.6 are all available as pinned options, and Claude Sonnet 5 as a pinned option that produces the steadiest run-to-run scores, though at a higher per-review cost than Sonnet 4.6. OpenRouter-hosted models like GLM 5.1 are also supported as a lower-cost alternative.
If you run Claude through your own AWS account, Claude Platform on AWS is supported as a third provider — Opus 5, Opus 4.8, Opus 4.7, Sonnet 5 and Sonnet 4.6 can each be routed through your own AWS credentials instead of a direct Anthropic key.
You can switch models at any time from Review Settings. The scoring rubric, anchored examples, and ESF system are designed to work with any capable model. As model providers release new models, we tend to upgrade quickly -- improvements in the underlying model translate directly to better scoring accuracy without disrupting existing scores. See the AI Model Benchmark for a detailed comparison of Haiku 4.5, Sonnet 4.6, Sonnet 5, Opus 4.6, and the OpenRouter candidates on cost, accuracy, and stability.
Bring your own API key. GitVelocity lets you use your own provider key — Anthropic, OpenRouter, or both. This means scoring costs are transparent and under your control. You provide the key during onboarding, and GitVelocity uses it to call whichever model you select for all PR analysis in your organization.
Consistency Guarantees
A scoring system is only useful if the numbers are stable. GitVelocity achieves consistency through three mechanisms:
Anchored examples. The scoring rubric includes 18 reference examples (three per dimension at LOW, MID, and HIGH levels) that serve as calibration anchors. These examples reduce interpretive drift and ensure that the AI applies scores consistently across different types of work.
Strong model. Using a capable model minimizes scoring variance. Opus produces the tightest dimension-level consistency, while Sonnet delivers reliable aggregate trends at lower cost.
Reproducibility. When the same PR is scored multiple times, the results land within a 2-4 point range. This narrow variance means you can trust the scores for trend analysis and cross-team comparisons.
What the Score Is NOT
Understanding what scores do not represent is just as important as understanding what they do:
- Not a quality judgment. A score of 8 means the PR was small, not that it was bad. Typo fixes, config changes, and dependency bumps keep the system running — they just are not complex.
- Not a performance grade. The score measures the complexity of a single change, not the value of the engineer. An engineer who ships ten small PRs totaling 120 velocity points may be more productive than one who ships a single 60-point PR.
- Not a target to optimize. Chasing high scores means avoiding small PRs, which is the opposite of good engineering practice. Small, focused PRs are better for review, easier to debug, and lower risk.
- Not useful in isolation. What matters is velocity over time — the aggregate complexity of work shipped per engineer, per team, per week. Any individual PR is just one data point.
Score Distribution
The score distribution is intentionally right-skewed. Most engineering work falls in the 10-40 range, and that is healthy.
| Range | What to Expect |
|---|---|
| 1-15 | Config tweaks, typo fixes, dependency bumps, minor refactors |
| 16-30 | Focused bug fixes, small features, meaningful test additions |
| 31-50 | Multi-component features, substantial refactors, new API endpoints |
| 51-75 | New systems, complex integrations, architecture changes |
| 76-100 | Large-scale rewrites, critical infrastructure, full features end-to-end |
A team where every PR scores 70+ is probably under-decomposing their work. The goal is not to push scores higher — it is to make engineering work visible so that hard, impactful work gets the recognition it deserves.
Frequently Asked Questions
Can engineers game the scores?
The AI reads actual code diffs and evaluates substance across six dimensions. Splitting one PR into five does not increase total score -- the complexity is in the code, not the ticket count. Adding meaningless code does not help either. The most effective way to increase your scores is to take on genuinely complex work. See the FAQ for more detail.
Why not just use story points?
Story points are subjective estimates made before the work happens. They measure what the team guessed, not what was actually shipped. Two teams will assign different point values to identical work. GitVelocity scores what actually shipped, consistently and objectively.
Can I customize the scoring weights?
The six dimensions use simple addition with no hidden weights. You can customize the scoring prompt from your Review Settings to adjust how the AI evaluates your team's specific codebase patterns, but the default rubric works well for most teams.